
India's land intelligence,
inside your system.
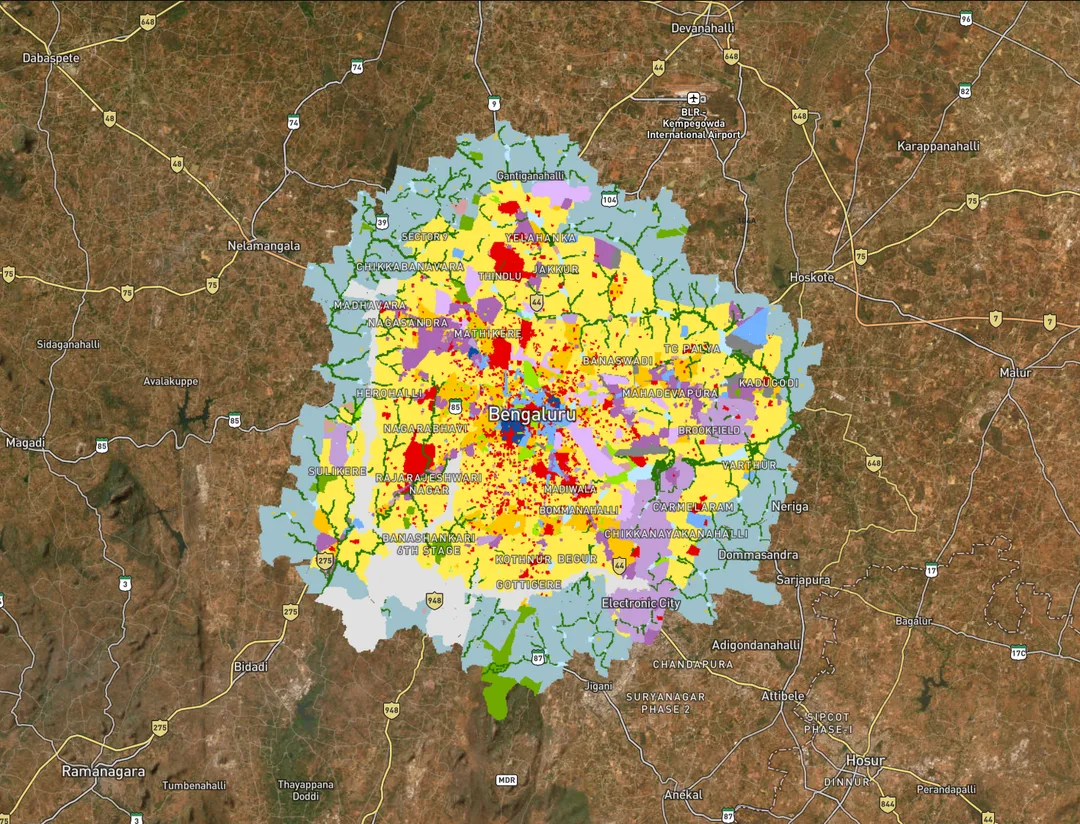
Every map layer and land evaluation tool on 1acre, masterplans, survey numbers, roads, flood risk, slope, and 50+ more, licensed as APIs and data feeds. On your map, or straight into your workflow. Any format your system takes.
- 300+
- Map Layers
- 50+
- Tool Outputs
- 20
- States Covered
- Any Format
- Tiles · GeoJSON · WMS · REST
Your map, or your pipeline. Your call.
Two ways to consume the same stack. Most teams use both.
1824.5
kWh/m²/yr
1825kWh/m²/yr
GHI — Global Horizontal Irradiance · PSH — Peak Sun Hours (1 PSH = 1 kWh/m²)
- Zone
- Zone II
- Peak sun hours
- 5.00 hr/day
- Seasonality
- Peak: Mar (6.3 PSH) · Low: Aug (4.1 PSH)
- Monsoon dip (Jun–Sep)
- −11% 5.4 → 4.8 PSH/day
- Data availability
- 1984–2025
- Data source
- NASA POWER model
Annual solar irradiance of 1824 kWh/m²/yr (5.0 peak sun hours/day). Solar resource is good — viable for utility-scale PV, agri-solar, and large rooftop systems. Data covers 1984–2025.
Monthly GHI — last 12 months (kWh/m²/day · daily avg)
Annual PSH trend (2006–2025)
↓Declining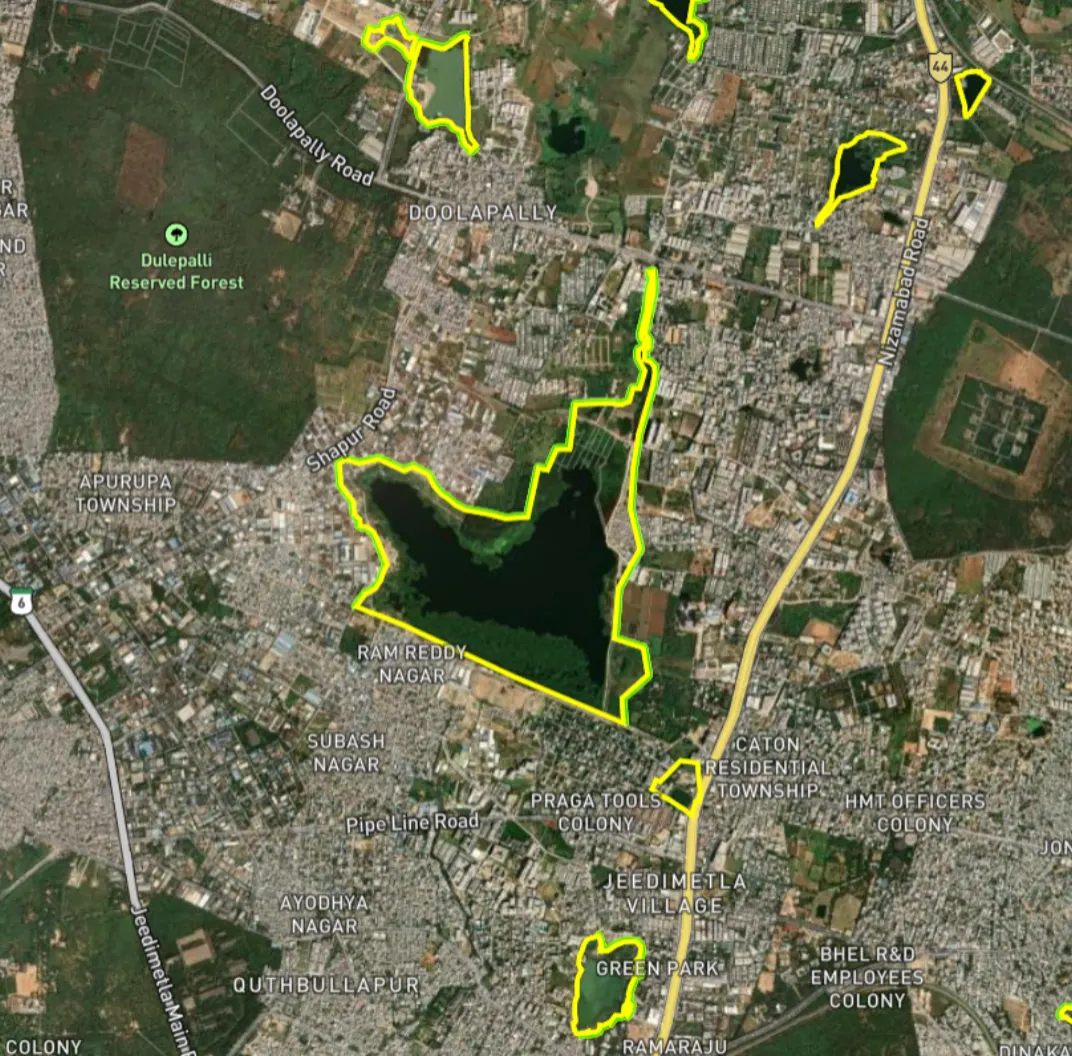
LOCATION
- Nearest flood zone
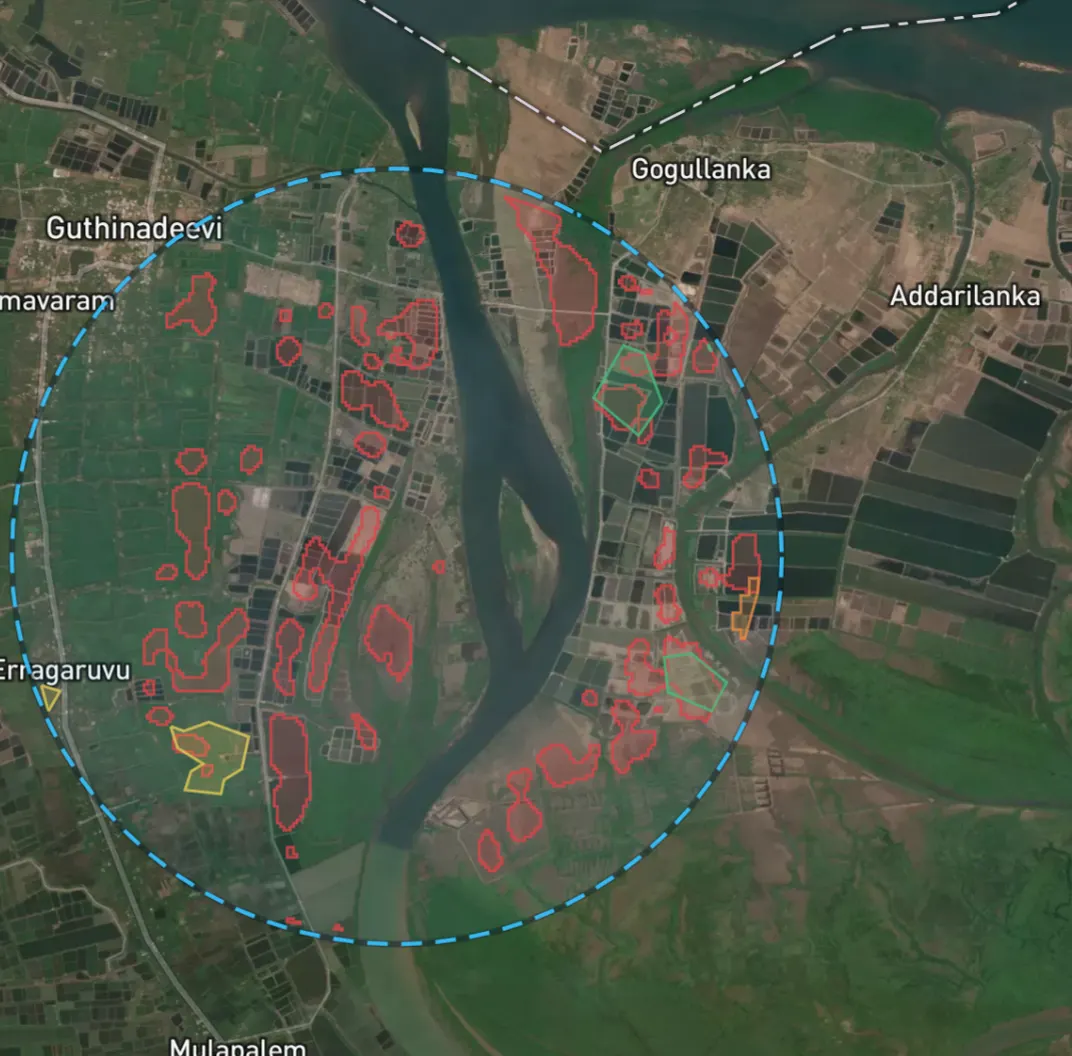
- 68m NW · 1 event
LOCALITY (2000M RADIUS)
- Flooded in 2000m radius
- 13.3% of 1257 ha search area
- Land-only flood risk
- 15.5% of 1078 ha land area flooded
- Nearest water body
- 0m · River / Stream
- Events in radius
- 4
- Largest single event
- 12%
- Before 2010
- 0 events
- 2010 – 2020
- 2 events
- After 2020
- 2 events
- Years since last event
- 4
- Peak months
- Sep
Map layers — click to toggle
- 05 Sep 2024
- 05 Nov 2012
- 08 Sep 2010
- 15 Jul 2022
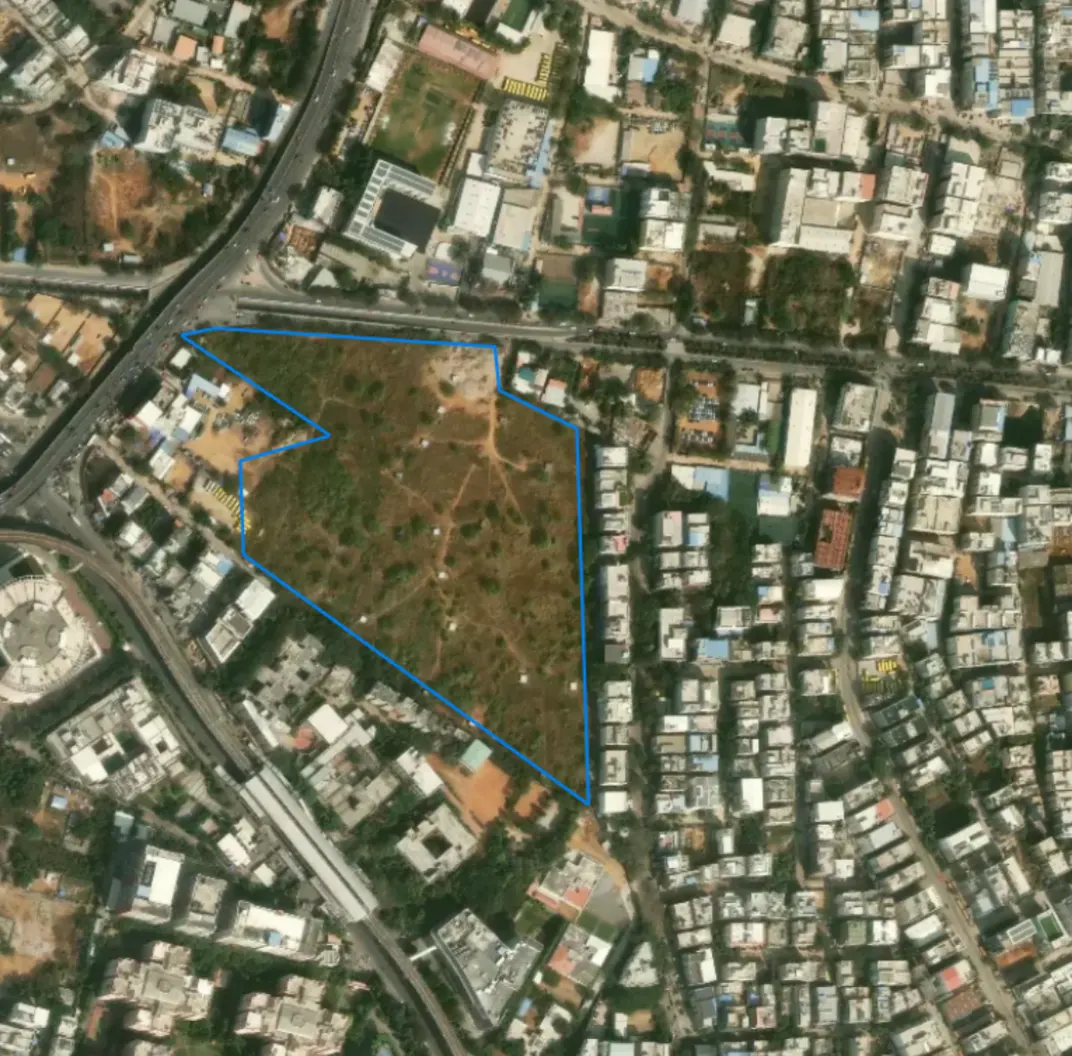
No direct flood record at this exact location. The nearest flood zone is 68m to the NW (1 event recorded there). In the 2000m search radius, 13.3% of the area has been flooded across 4 events.
Source: NRSC NDEM Flood Hazard Atlas (1998–2024), satellite-observed inundation polygons
All distances are straight-line (radial), not road distance.
 Masterplan Zoning
On your map
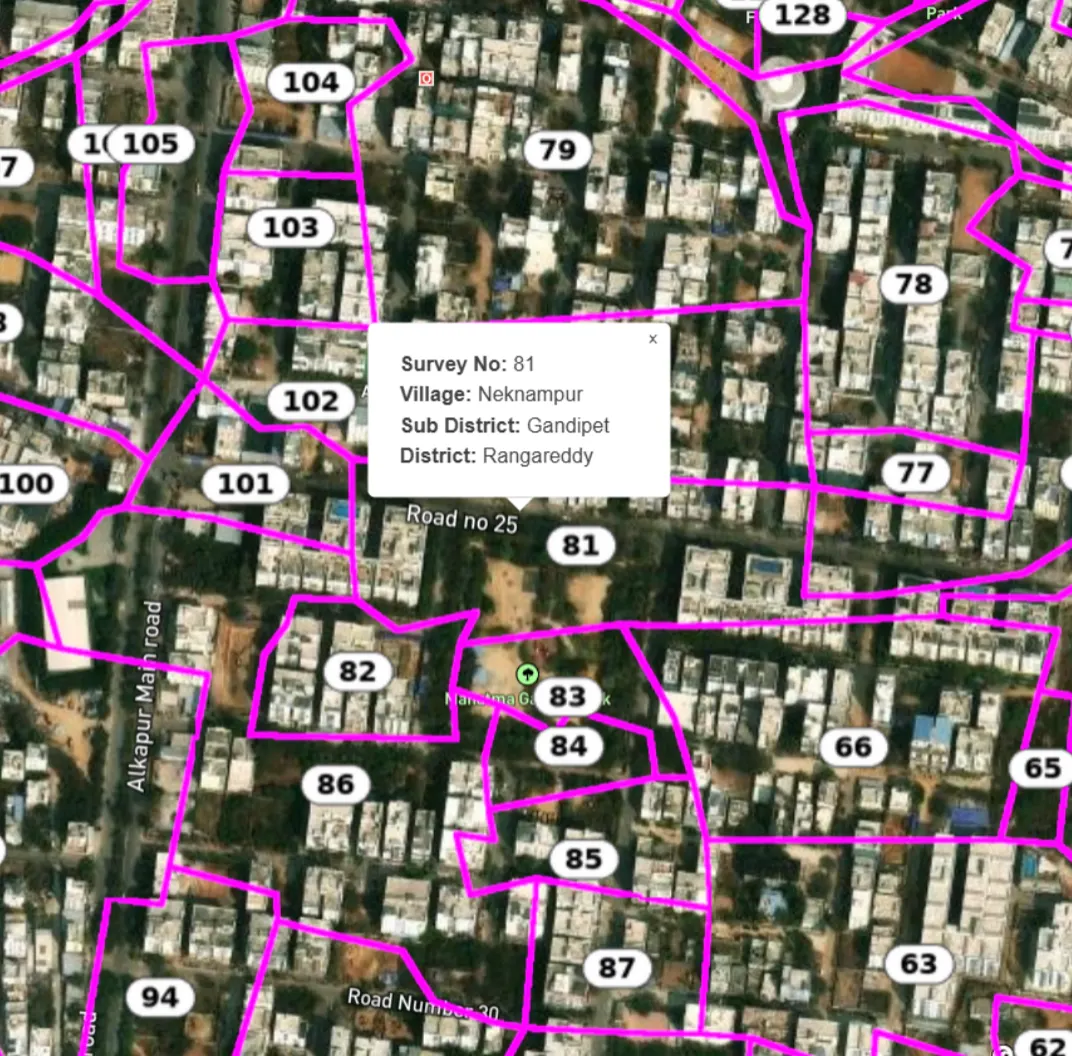
Overlay our layers on your internal GIS or dashboard. Survey boundaries, masterplan zoning, roads, metro, lakes & FTL, restricted zones, rendered live on the map your team already works on.
- Vector Tiles
- Raster Tiles
- WMS / WMTS
- GeoJSON
Into your system
Query any parcel and get structured data back, survey number, zoning, flood risk, slope, distances, estimates. Feed your credit engine, feasibility model, site-selection score, or your AI agents, directly.
- REST API
- Per-parcel Lookup
- Batch Feeds
- Webhooks
- MCP Server
300+ map layers and 50+ tool outputs, licensed by geography. Everything we add during your contract is included., and we refine outputs to the shape your system expects.
Built for how your industry uses land
Same stack. Refined and customised to your use case.
Banks, HFCs & NBFCs
Why you need this
Every land-collateral file needs verification: is the survey number real, what does zoning permit, is it in a flood or buffer zone. Manual valuer reports take days and vary by valuer.
What we provide
- Survey boundary
- Zoning
- Restriction flags
- Risk indicators
One API call per file, structured for your credit and collateral systems. Consistent, instant, auditable.
How licensing works
Annual licence, scoped to your geography and usage.
What you get
Included
- All layers and tool outputs in your licensed geography
- Everything we ship during your contract, included
- Delivery in the format your stack already speaks
- Documentation, sandbox access, integration support
- Annual license, scoped to your geography and usage
What we don't do
Out of scope
- No bulk data exports or one-time dumps
- No resale or redistribution of licensed data
- No unscoped access, licenses are per geography
- No hidden charges, one annual fee, one integration fee
Simple 4 step process
- 1
Submit Requirement
Use case, geography, and how your system consumes data.
- 2
Scoping Call in 48 Hours
We map your requirement to layers, tools, and delivery format.
- 3
Sandbox Key & Samples
Test with real data for your geography before you commit.
- 4
Contract & Go Live
Annual license. Integration support included.