
Cyclone Risk for Any Plot in India
Recorded cyclone exposure, the IS 875 (Part 3) design wind zone, and every tropical cyclone logged within 100 km — from IMD / RSMC New Delhi best-track records going back to 1842.
What cyclone risk means for a plot — and what it does not
India has the longest cyclone-exposed coastline of any country in the Indian Ocean region. For land, cyclone risk resolves into three separate questions: how often storms have actually passed this location, what wind speed the building code makes you design for, and what that combination does to construction and insurance cost.
Exposure is history, not forecast
Everything in this tool is a record. The India Meteorological Department, as the Regional Specialised Meteorological Centre for the North Indian Ocean, maintains best-track archives of tropical cyclones going back to 1842. Counting how many of those tracks passed within 100 km of a plot tells you whether it sits on a recurring storm corridor. It tells you nothing about next season.
The design wind speed is the number that costs money
IS 875 (Part 3) assigns a basic wind speed to every part of India, from 33 m/s inland to 55 m/s on the most exposed coasts. That figure is a legal input to structural design: it sets roof anchorage, cladding fixings and the lateral load case. Two otherwise identical plots in different zones do not cost the same to build on, and that gap is knowable before you buy.
India’s recorded cyclone exposure
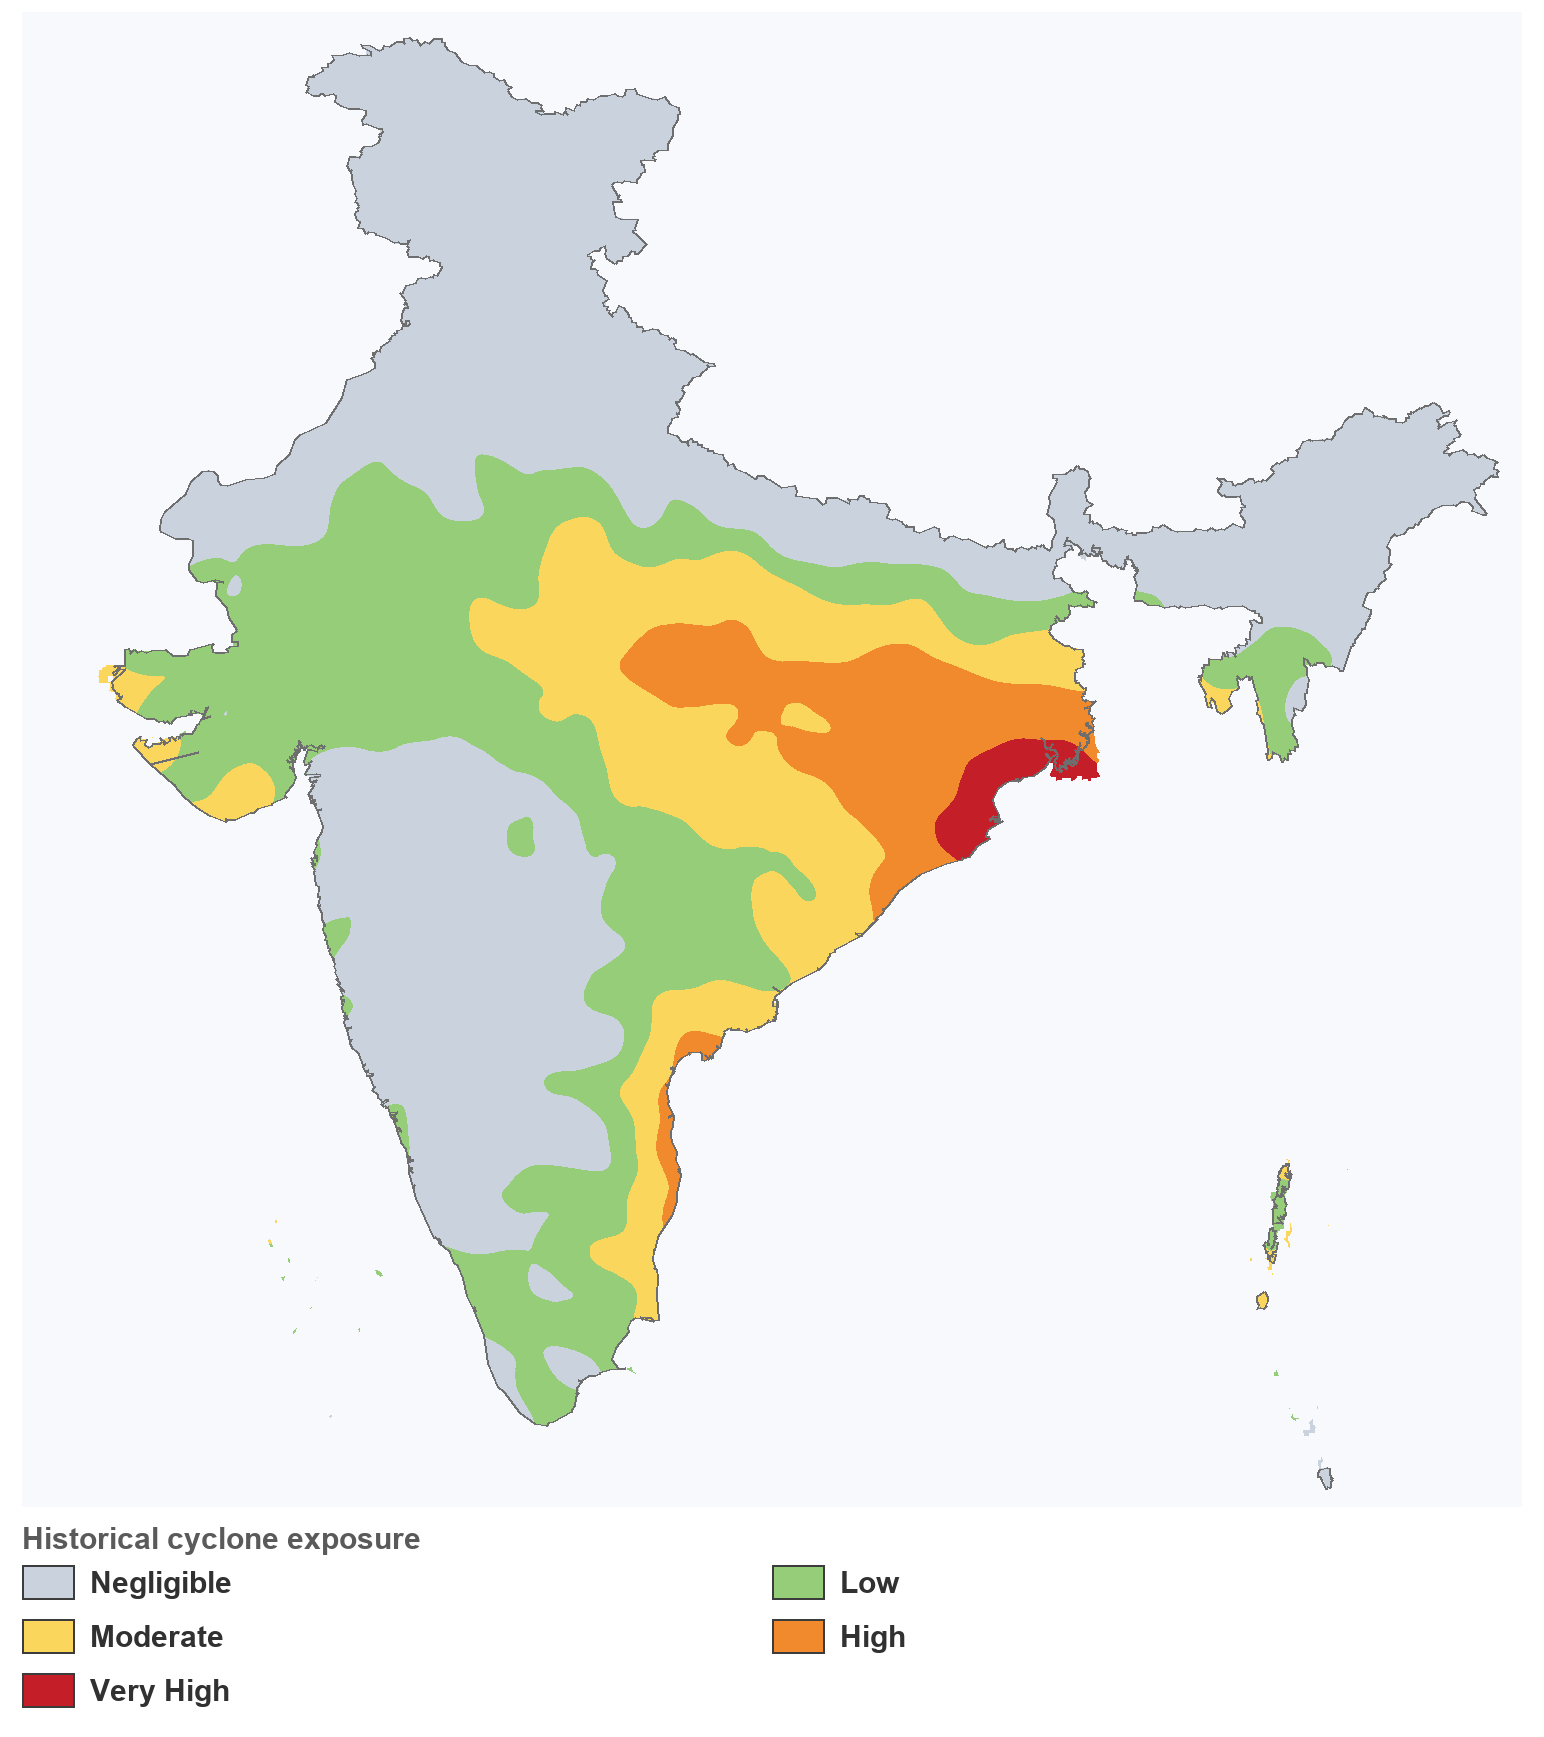
The map below is a historical cyclone-exposure surface: for every point in India it measures the intensity-weighted density of tropical-cyclone tracks that have passed nearby across the recorded best-track history (IMD / RSMC New Delhi, 1842 to present). It is coastal-concentrated — the east coast reads High to Very High, the Arabian-Sea west coast lower, and the deep interior Negligible. Your plot’s class on this surface is what drives the tool’s verdict.
Why the Bay of Bengal dominates
The Bay of Bengal produces roughly four cyclones for every one in the Arabian Sea, and its shallow, narrowing northern end amplifies storm surge far beyond what the same wind speed would produce elsewhere. Odisha, Andhra Pradesh, West Bengal and coastal Tamil Nadu carry India’s highest recorded exposure. The Gujarat and Konkan coasts are genuinely exposed but less frequently; the interior Deccan mostly sees remnant rain rather than damaging wind.
What do these numbers mean?
The result card separates what has been recorded from what the code requires. Here is how to read each part.
How the analysis works
Two independent sources: a recorded-track archive and a national design standard.
You mark the site
Draw the plot boundary, drop a pin, or type an address. Cyclone exposure varies over tens of kilometres, so the centroid is what the reading uses — the polygon shape matters far less than the location.
We search the IMD best-track archive
Every tropical cyclone track recorded in the North Indian Ocean since 1842 is checked against a 100 km radius around your plot. Passages are counted once per storm and summarised into an activity level.
We read the IS 875 wind zone
The basic wind speed for the location comes from the IS 875 (Part 3) zone map — the same figure a structural engineer designs to. It is reported alongside the history rather than blended into it, because one is a record and the other is a requirement.
Methodology and data sources
Recorded tracks from IMD / RSMC New Delhi; design wind speed from IS 875 (Part 3). Neither is a forecast.
Cyclone history: IMD / RSMC New Delhi best tracks
The India Meteorological Department, acting as the Regional Specialised Meteorological Centre for the North Indian Ocean, maintains the authoritative best-track archive of tropical cyclones in the Bay of Bengal and Arabian Sea. Best tracks are the post-season reanalysis of each storm’s position and intensity — more accurate than the operational advisories issued at the time. We count tracks passing within 100 km of the plot, once per storm.
Design wind speed: IS 875 (Part 3)
IS 875 (Part 3) is the Indian standard for wind loads on buildings and structures. It divides India into basic wind speed zones from 33 m/s to 55 m/s, and that figure is a legal input to structural design. It is reported here unchanged, not combined with the exposure class.
Limitations
- Not a forecast. Every number is a record of past storms or a code requirement. Nothing here estimates the probability of a cyclone in any future period.
- Exposure is descriptive. The exposure class is an intensity-weighted density of recorded tracks. It is not a return period, not an annual probability, and not an insurance rating.
- Passages, not impacts. A track within 100 km is not damage at the plot. Actual impact depends on intensity at closest approach, storm size, terrain and surge exposure.
- Storm surge is not modelled. Surge risk depends on coastal bathymetry and local elevation, neither of which this tool reads. For a low-lying coastal plot, commission a surge study.
- Exposure may be unavailable. The exposure raster is deployed separately from the track archive. Where it is missing, the report says so and still reports history and wind zone — a missing class is never shown as low risk.