
Solar Resource Analysis for Any Plot in India
Annual GHI, PV yield, monthly irradiance profile, and MNRE zone — for any location in India. Site-accurate 250 m resource data from the Global Solar Atlas, with monthly seasonality from NASA POWER.
What is solar resource — and why does it determine whether a project works?
Every solar project — a 500W rooftop system or a 100 MW solar farm — has one common input that drives every other number: how much solar energy lands on the site, on average, year after year. That number is GHI — Global Horizontal Irradiance, measured in kilowatt-hours per square metre per year.
What GHI actually measures
GHI is the total solar energy landing on a flat horizontal surface, combining both direct sunlight and diffuse sky radiation (light scattered by clouds and atmosphere). It is the standard quantity used worldwide to estimate how much electricity a solar panel array will generate. Annual GHI in kWh/m²/yr divided by 365 gives you peak sun hours per day — the number of hours at standard irradiance (1,000 W/m²) that would deliver the same energy as the real daily solar cycle.
Example: A site with annual GHI of 1,900 kWh/m²/yr has 5.2 peak sun hours/day. A 1 kWp solar panel array at that site, assuming 80% system efficiency, will generate 1,900 × 0.80 = 1,520 kWh of electricity per year.
The three use cases where this matters
Utility-scale solar scouting (10+ acres)
For a ground-mounted solar farm of 1 MW or more, GHI is the first number that determines whether the project is bankable. India’s solar tenders typically require a minimum annual GHI that corresponds to MNRE Zone II or above. Rajasthan, Gujarat, and western Madhya Pradesh — all firmly in Zone I — have attracted the bulk of India’s utility-scale capacity because of this. A site in Assam or Meghalaya scoring Zone III needs better economics (lower land cost, proximity to grid) to compensate for lower irradiance.
Agri-solar feasibility (5–100 acres)
Agri-solar (agrivoltaics) combines row crops with solar panels on elevated structures. The approach works best when GHI is high enough to run a commercial PV system profitably while leaving enough diffuse light for shade-tolerant crops underneath. In India, agri-solar projects are concentrated in Rajasthan, Andhra Pradesh, and Maharashtra — states with strong irradiance and large landholdings. A site check on irradiance is the first filter before evaluating crop selection and power purchase agreement terms.
Warehouse and industrial rooftop sizing
A 10,000 sq ft warehouse roof in Pune (Zone II, ~1,750 kWh/m²/yr) can support a 300–400 kWp system generating 4–5 lakh kWh per year — enough to offset most daytime factory load. The same roof in Guwahati (Zone III, ~1,350 kWh/m²/yr) generates 20–25% less, which changes the payback period from 4 years to 5–6 years. Site irradiance is the first check before calling an EPC contractor.
How India’s solar zones break down
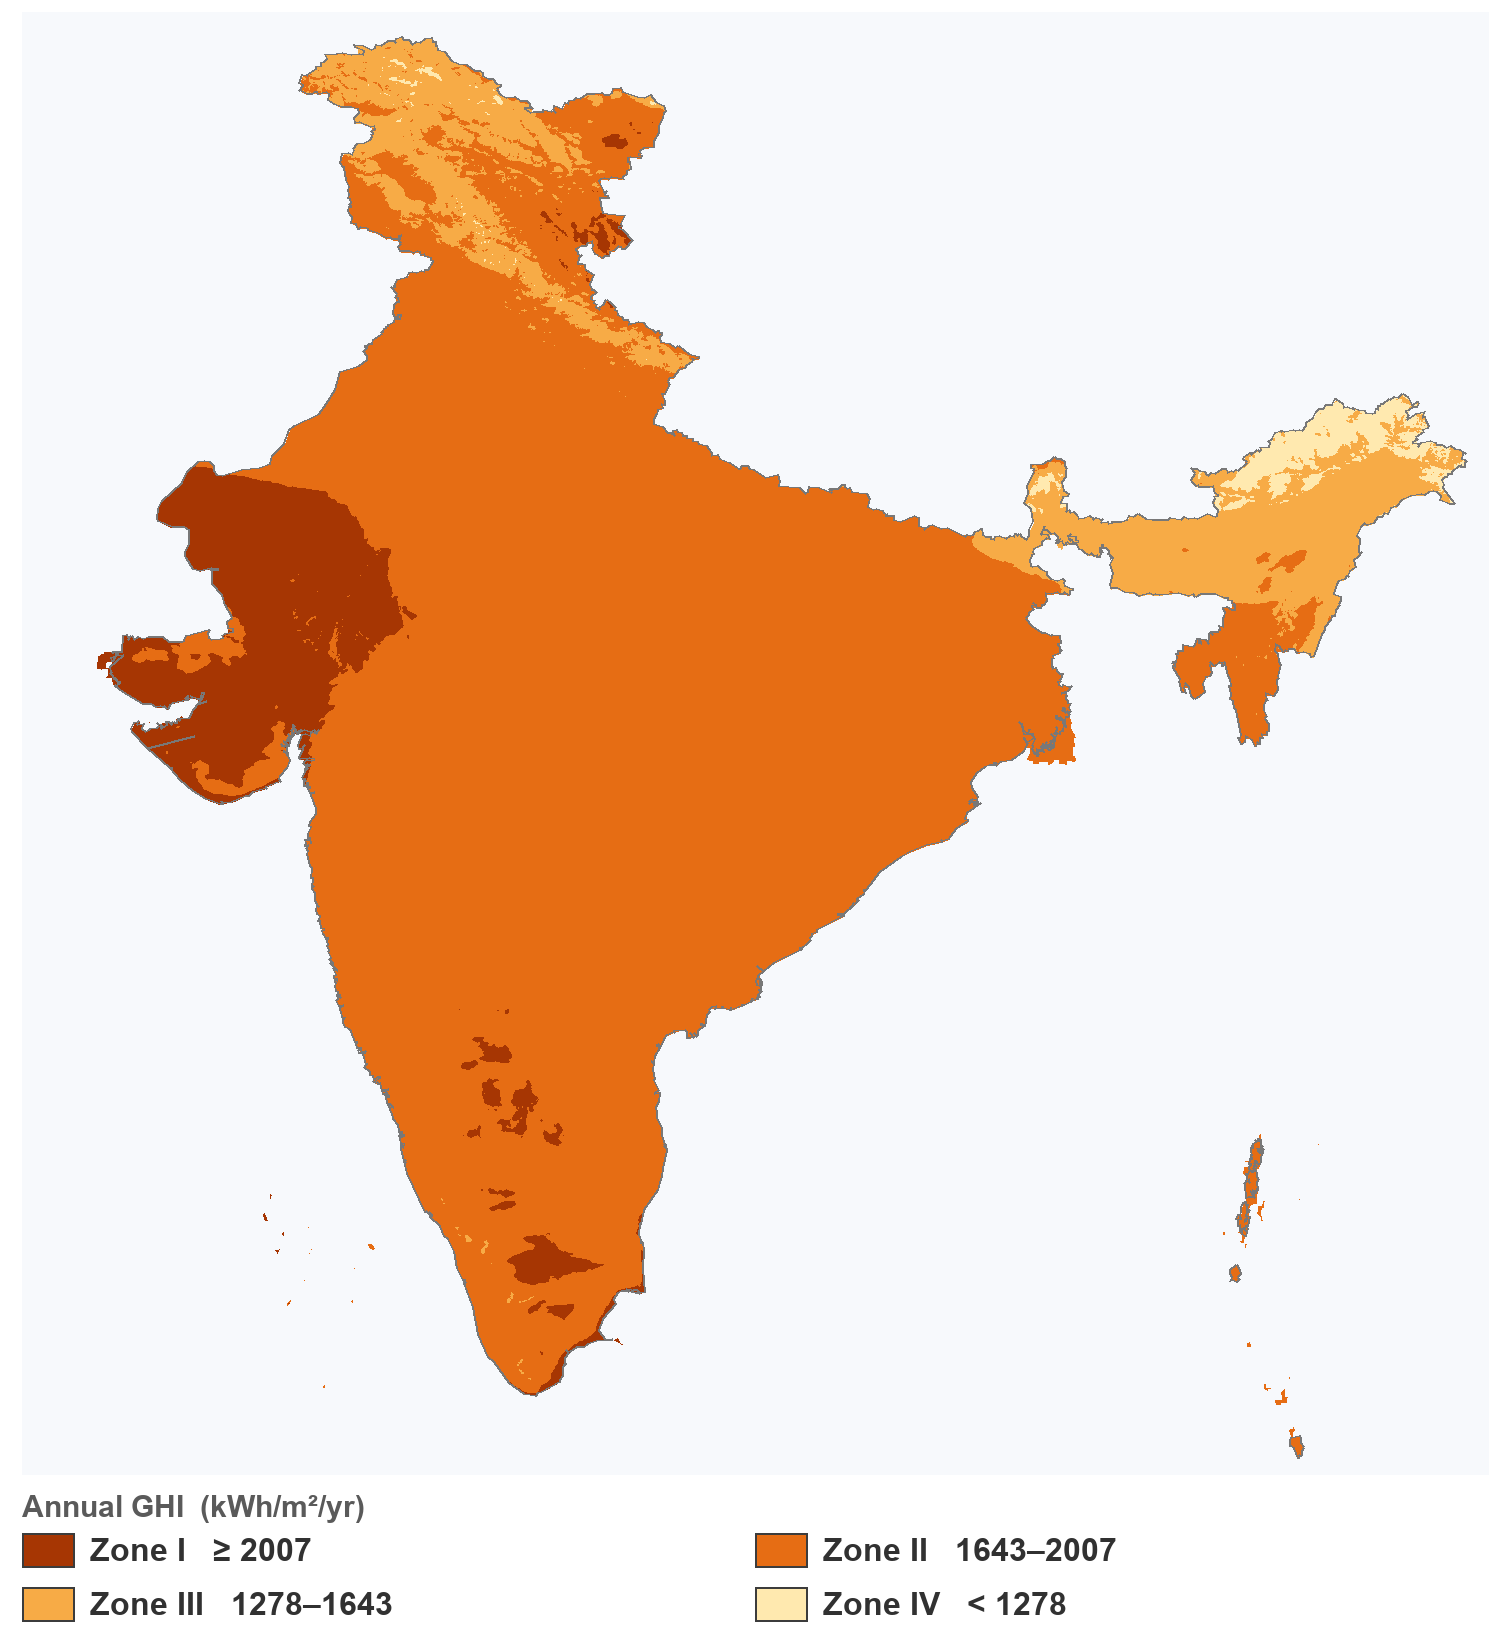
The Ministry of New and Renewable Energy (MNRE) uses a four-zone classification based on annual GHI:
- Zone I (≥ 2007 kWh/m²/yr, ≥ 5.5 peak sun hrs/day): Rajasthan, Gujarat, western and central Madhya Pradesh, parts of AP and Telangana. India’s solar belt. Ideal for utility-scale, CSP, and agri-solar.
- Zone II (1643–2007 kWh/m²/yr, 4.5–5.5 hr/day): Most of peninsular India — Maharashtra, Karnataka, AP, Telangana, Tamil Nadu, Odisha. Viable for all solar applications.
- Zone III (1278–1643 kWh/m²/yr, 3.5–4.5 hr/day): Parts of the Northeast, higher elevations, west coast during monsoon. Suitable for rooftop; utility-scale needs site study.
- Zone IV (< 1278 kWh/m²/yr, < 3.5 hr/day): Rare in India. Rooftop solar is still viable but system sizing and payback calculations need adjustment.
The monsoon factor
India’s monsoon creates the largest seasonal irradiance swing of any major solar market in the world. June–September sees cloud cover reduce GHI by 40–60% across the south and east coast. The monthly chart in your result card makes this visible — you’ll see a clear dip in the June–September bars. Two things matter for project planning:
- Peak months (March–May): These pre-monsoon months deliver the highest irradiance in peninsular India. Rajasthan peaks slightly earlier (February–April) due to longer days and minimal cloud cover.
- Annual average is what matters, not peak month: A system sized on the peak month will be oversized for 8 months of the year. Size on annual GHI; use monthly data to plan battery storage and export management.
What do these numbers mean?
The result card gives you the site's solar resource, the electricity it could generate, and its month-by-month pattern. Here is how to read each one.
India's MNRE Solar Zone Classification
The Ministry of New and Renewable Energy (MNRE) divides India into four solar resource zones based on annual GHI. Zones I–II are viable for utility-scale projects without subsidies. All four zones support rooftop solar.
| Zone | Annual GHI (kWh/m²/yr) | Peak Sun Hrs/Day | Representative States | Best suited for |
|---|---|---|---|---|
| Zone I | ≥ 2,007 | ≥ 5.5 hrs | Rajasthan, Gujarat, western & central MP, parts of AP & Telangana | Utility-scale PV, CSP, agri-solar, ground-mounted farms |
| Zone II | 1,643 – 2,007 | 4.5 – 5.5 hrs | Maharashtra, Karnataka, AP, Telangana, Tamil Nadu, Odisha, parts of UP | All solar applications — utility, agri-solar, large rooftop |
| Zone III | 1,278 – 1,643 | 3.5 – 4.5 hrs | Parts of Northeast, west coast (Goa, Kerala), higher elevations, eastern Bihar | Rooftop solar; utility-scale requires detailed site feasibility study |
| Zone IV | < 1,278 | < 3.5 hrs | Rare in India — parts of Northeast, high-altitude Himalayan regions | Rooftop solar with careful system sizing and adjusted payback assumptions |
Source: Ministry of New and Renewable Energy (MNRE), Government of India — Solar Zone Classification used in national solar energy policy and tender eligibility criteria.
How the analysis works
Two data sources, each used for what it does best. No file download.
You mark the site
Draw the plot boundary, drop a pin, or type an address. We extract the centroid — solar irradiance varies smoothly over distance, so the specific polygon shape matters less than its location.
We read the Global Solar Atlas at your point
The Global Solar Atlas 2.0 gives the site-accurate headline — annual GHI, PV yield (PVOUT), DNI, optimum panel tilt, and mean air temperature — at 250 m resolution. It is a long-term multi-year average, so the numbers reflect the site’s true climatology, not one recent year.
NASA POWER adds the seasonal shape
The Atlas is a static average with no month-by-month record, so we layer NASA POWER’s monthly time-series (1984 to present) on top for the seasonality chart and the long-term trend. You get the accurate headline plus the full monsoon-dip pattern — and the MNRE zone from the Atlas GHI.
Methodology and data sources
A hybrid of two datasets: the Global Solar Atlas for the site-accurate resource layer, NASA POWER for the monthly seasonality. NASA POWER responses are cached per 0.5° grid cell in PostGIS for 30 days.
Primary source: Global Solar Atlas 2.0 (headline + MNRE zone)
The Global Solar Atlas 2.0 is produced by Solargis for the World Bank Group / ESMAP. It is a long-term, multi-year climatological average — a static resource layer, not a month-to-month feed — so the numbers reflect the site’s true long-run solar climate. It drives the headline metrics and the MNRE zone verdict. Layers we sample: GHI (Global Horizontal Irradiance), PVOUT (PV energy yield per kWp), DNI (Direct Normal Irradiance), optimum panel tilt angle, and mean air temperature. Resolution: 250 m for GHI and DNI, 1 km for PVOUT and air temperature. License: CC BY 4.0 — attribution required, commercial use permitted.
Secondary source: NASA POWER (monthly seasonality + trend)
The Global Solar Atlas is a static average with no month-by-month history, so the monthly profile and interannual trend come from NASA POWER (Prediction Of Worldwide Energy Resources), operated by NASA Langley Research Center from the CERES SYN1deg + MERRA-2 products. It provides monthly data from 1984 to present at 0.5° (~55 km). At 55 km it is too coarse for a site-specific headline number — so we use it only for the seasonal shape (the monsoon-dip pattern) and long-term variability, never for the zone or the headline. License: CC BY 4.0.
Why two sources
Each dataset is used for what it is best at. The Global Solar Atlas gives high-resolution (250 m), site-accurate resource — but as a static climatology it carries no monthly time-series. NASA POWER gives a dated monthly record back to 1984 — but at 55 km it is too coarse to tell one plot from its neighbour. Combining them gives you an accurate headline and zone from the Atlas, plus the real seasonal pattern and long-term trend from NASA POWER.
PVOUT — the developer-facing headline
PVOUT is the yearly kWh generated per kWp of PV installed, already accounting for real-world losses (temperature, soiling, wiring, inverter). It is what a solar developer sizes and prices a plant on — one step past raw GHI. From PVOUT we also return two reusable planning outputs at typical Indian densities: ground-mount ~225 kWp/acre and rooftop ~0.125 kWp/m². Multiplied by PVOUT, these give indicative annual generation per acre and per m². Treat both as planning estimates at typical densities — not a bankable yield assessment.
The resource heatmap
After the analysis, the map draws a resource overlay for a 5 km radius around your site, rendered from the same Global Solar Atlas raster. Hovering reads out the exact value under the cursor, and the legend spans the local minimum to maximum — so a flat gradient means the resource genuinely does not vary across the area, not that the overlay failed. It is a best-effort layer: if it is unavailable the result card is unaffected.
How we classify results
MNRE Solar Zone Classification based on annual GHI from the Global Solar Atlas:
- Zone I (good): Annual GHI ≥ 2007 kWh/m²/yr (≥ 5.5 peak sun hr/day)
- Zone II (moderate): 1643–2007 kWh/m²/yr (4.5–5.5 hr/day)
- Zone III (poor): 1278–1643 kWh/m²/yr (3.5–4.5 hr/day)
- Zone IV (severe): < 1278 kWh/m²/yr (< 3.5 hr/day)
Caching and freshness
The Global Solar Atlas layer is a static long-term average and does not change between queries. NASA POWER monthly responses are cached per 0.5° grid cell in PostGIS for 30 days; the “freshness” field shows the date of the query. A second query at the same location within 30 days is served from cache — no additional NASA POWER call is made.
Limitations
- Screening, not bankable: Because of the model resolution and climatological averaging, this is a first-pass screen — not a P50/P90 energy-yield study. For project finance you still need a site measurement campaign (pyranometer, minimum 12 months).
- Seasonality is coarse: The monthly profile comes from NASA POWER at 55 km. It captures the true seasonal shape (monsoon dip, summer peak) for the region, but two nearby plots share the same monthly pattern. The site-specific number is the Global Solar Atlas headline, not the monthly bars.
- Static climatology: The headline is a multi-year average, so it does not reflect a single anomalous year. Long-term interannual variability is what the NASA POWER trend is for.
- Rooftop orientation: GHI is for a horizontal surface. A south-facing tilted roof in India (typically 10–25°) captures more — the Atlas returns the optimum tilt angle and DNI separately for more precise system modelling. PVOUT already reflects a fixed optimally-tilted system.
- Aerosols and soiling: Heavy aerosol loading (dust, industrial particulates) and on-site soiling reduce real-world output. These are not fully resolved at fine spatial scale — the reason a site measurement campaign remains necessary for project finance.