
Soil Fertility & Crop Suitability for Any Plot in India

How fertile the topsoil is, what its pH suits, and which broad crop categories fit — from national soil mapping, before you commission a soil test.

What this tool tells you

Four readings, in the order they matter when you are buying agricultural land.

Fertility

A composite of topsoil nitrogen, organic carbon and CEC — the soil’s ability to hold nutrients rather than let them wash through. Low, Moderate or High.

pH suitability

The acidity or alkalinity of the topsoil, and what it suits. pH caps which nutrients a plant can take up — regardless of whether they are present.

Water retention

Inferred from texture. Clayey soils hold moisture and suit paddy; sandy soils drain fast and need frequent irrigation; loams sit in between.

Crop hint

Broad crop categories from texture and pH. A planning estimate, not a recommendation — confirm with a soil-health-card test.

Fertility is not one number

Why the report prints the measurements, not just the rating.

1

The rating is a composite

Nitrogen, organic carbon and CEC are averaged into one word. That word hides which of the three is actually limiting.

2

pH can override all of it

An alkaline soil locks up iron and zinc even when they are present. Nutrients in the ground are not nutrients in the plant.

3

Salinity can defeat a fertile soil

Saline or sodic ground is crop-limiting on its own, and reclaiming it takes years. It is reported separately for that reason.

India’s soil quality at a glance

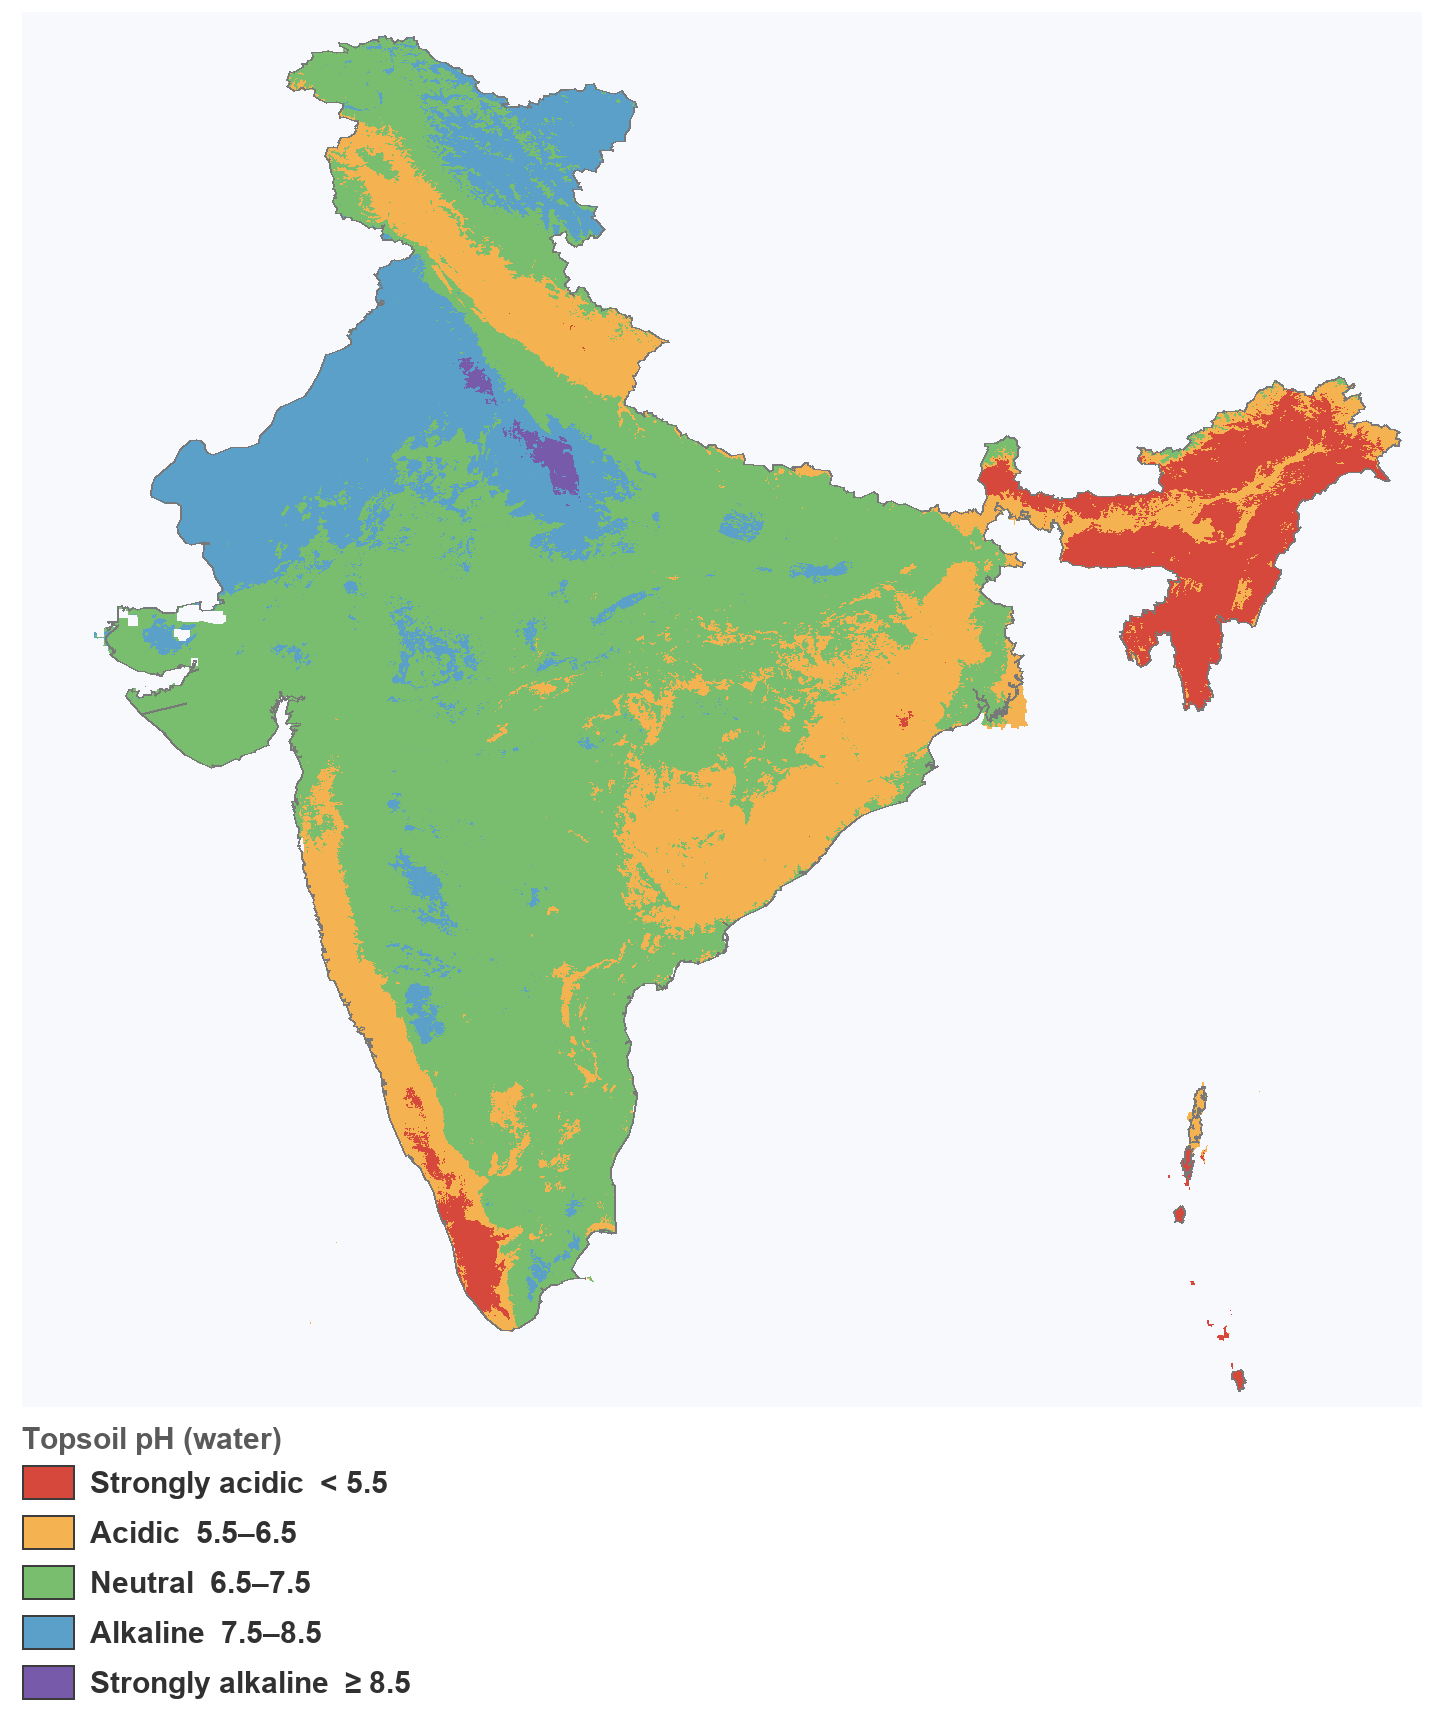
Two national views of the topsoil — our classification of the ISRIC SoilGrids model (illustrative, a ~1 km model, not a soil test). Left: organic carbon — the core of soil health and fertility. Right: pH — the acidity/alkalinity that caps which crops thrive.
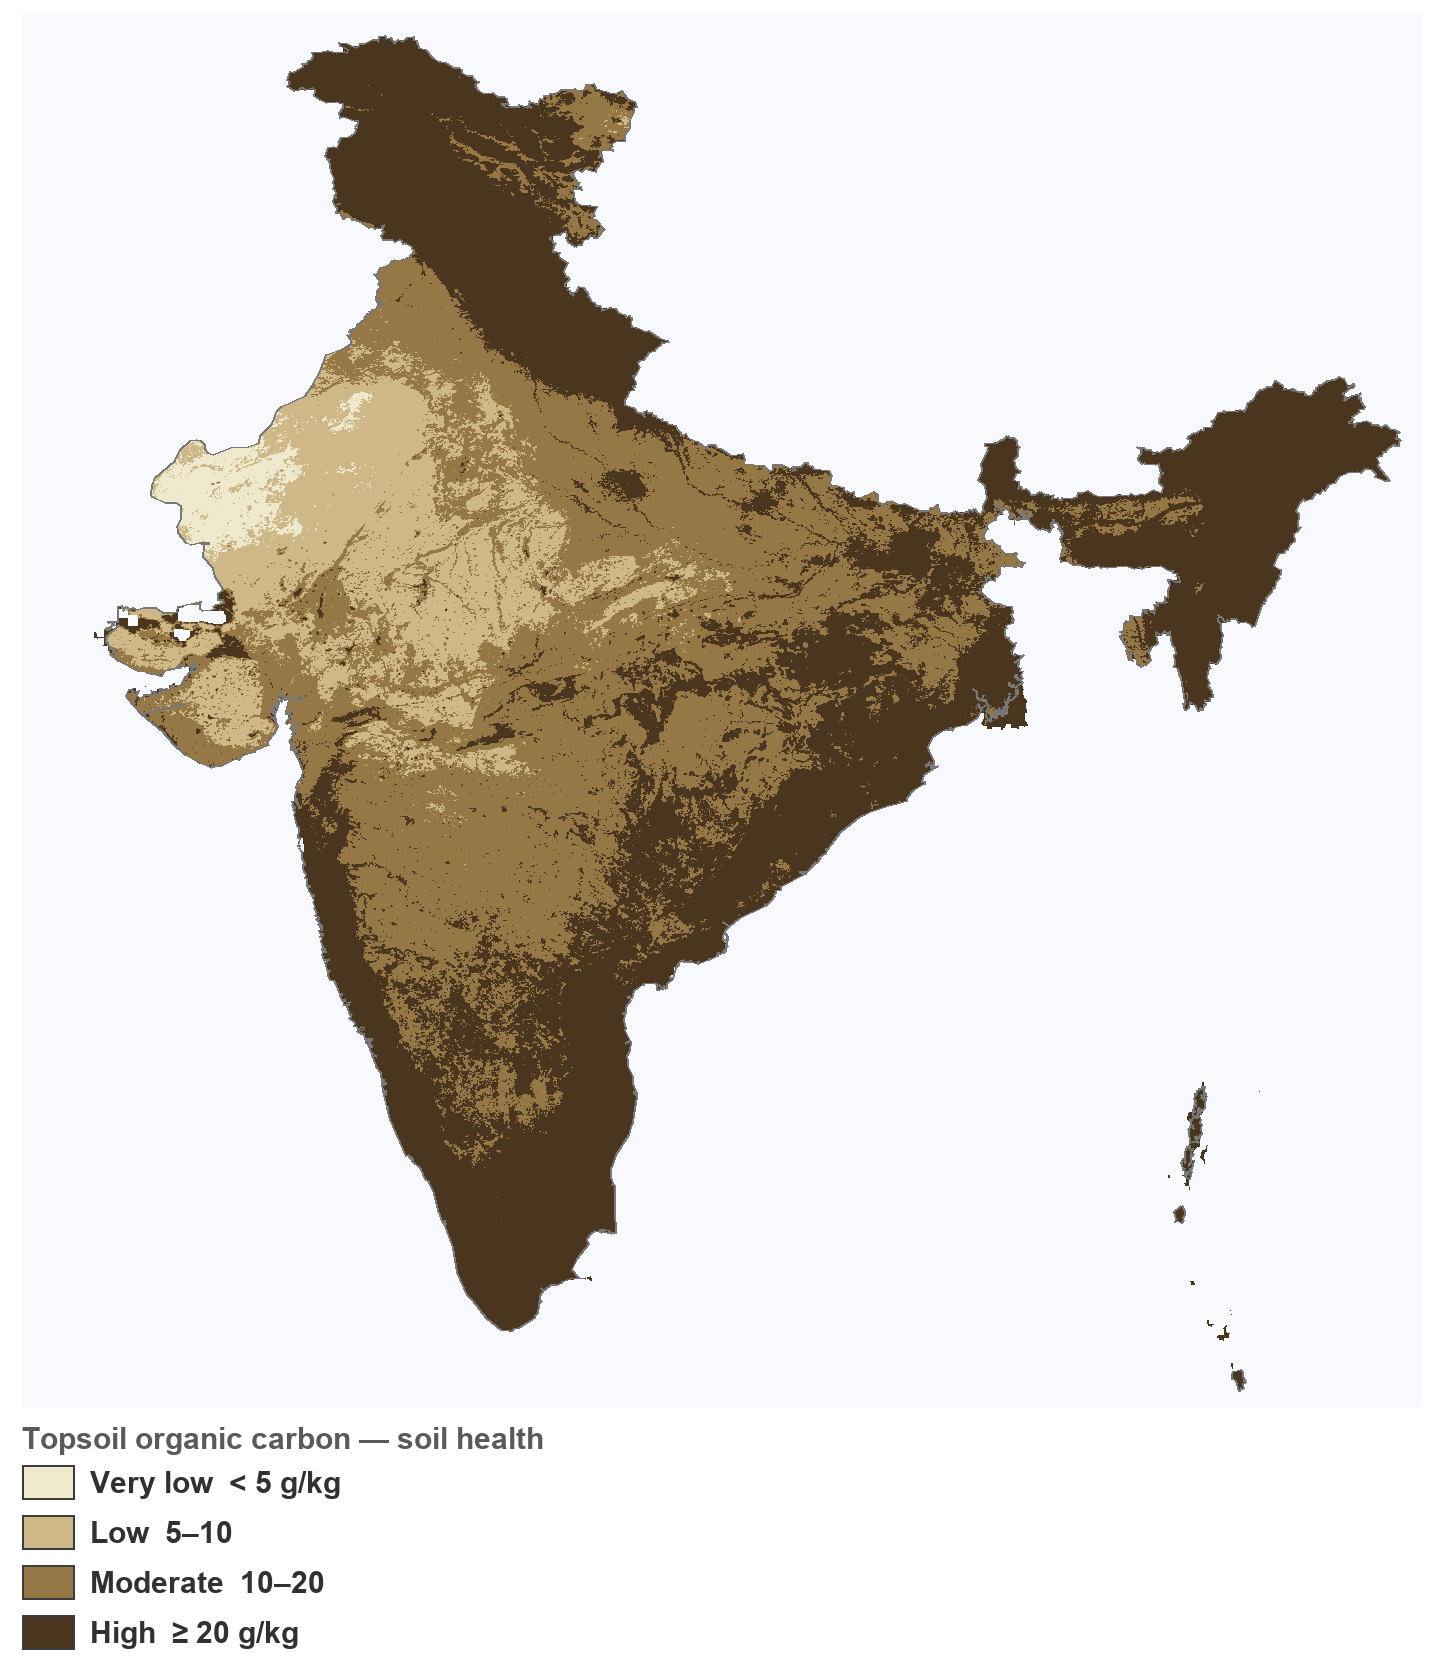
Map of India shaded by topsoil organic carbon; the Indo-Gangetic plains, north-east and Western Ghats are richer (higher organic carbon), while the arid north-west is lower.
Topsoil Organic Carbon (soil health)Higher = richer, more fertile soil. Most of India is moderate–high; the arid north-west is lower.
Map of India shaded by topsoil pH; the south, north-east and Western Ghats are acidic, the Indo-Gangetic plains near-neutral, and the north-west (Rajasthan/Punjab) alkaline.
Topsoil pHAcidic south / NE / Western Ghats (tea, coffee, cashew) vs alkaline north-west; near-neutral plains suit most crops.

Methodology and data sources

A survey map and a model, kept apart

Soil type, taxonomy, parent material, drainage, salinity and sodicity come from the ICAR-NBSS&LUP BHOOMI 1:250,000 soil map — the authoritative Indian classification. The chemistry beside them (pH, nitrogen, organic carbon, CEC) comes from ISRIC SoilGrids v2.0 (250 m native, CC BY 4.0), a spatial model rather than a survey. The report names which is which, because they do not carry the same weight.

Shortlisting, not fertiliser planning

SoilGrids predicts at roughly 1 km with an R² around 0.3–0.6, so these figures compare plots — they do not plan a crop. A government soil-health card measures your actual field for very little money, and your nearest Krishi Vigyan Kendra can read it with you. Use this tool to decide which plots are worth that test.

Frequently Asked Questions

What goes into the fertility rating?
It is a composite of three topsoil readings: nitrogen, organic carbon, and cation exchange capacity (CEC), which is the soil's ability to hold nutrients rather than let them wash through. Higher nitrogen, higher organic carbon and higher CEC together produce a higher rating. A soil can be low on the composite and still grow a specific crop well, which is why the report prints the individual measurements alongside the rating rather than only the verdict.
Why does pH matter so much?
pH decides which nutrients a plant can actually take up, regardless of whether they are present. Below about 6 the soil is acidic, which suits tea, coffee, cashew and rubber. Between roughly 6 and 7.5 is near-neutral and suits most cereals, pulses and vegetables. Above 8 is alkaline, which locks up iron and zinc and needs micronutrient management. The tool reports both the band and what it suits.
Can I trust the crop suggestion?
Treat it as a broad category, not a recommendation. It is inferred from texture and pH only — it knows nothing about your water availability, market access, labour, or what grows well for your neighbours. Every serious cropping decision should be confirmed with a local soil-health-card test and an agronomist or your nearest Krishi Vigyan Kendra.
What is water retention inferred from?
Soil texture. Clayey soils hold moisture well, which is why paddy does well on them; sandy soils drain fast and need frequent irrigation; loams sit in between and give balanced drainage. It is an inference from particle size, not a measurement of how much water your field actually holds.
Why do salinity and sodicity appear separately?
Because they are directly crop-limiting in a way the fertility composite does not capture. Saline or sodic ground can defeat an otherwise fertile soil, and reclaiming it is a multi-year project. These attributes come from the ICAR-NBSS&LUP survey and are only shown where your plot falls on a mapped sheet.
Is this a substitute for a soil test?
No. SoilGrids is a spatial model at roughly 1 km resolution with an R-squared around 0.3 to 0.6 — the right scale for comparing plots and shortlisting, not for fertiliser planning. A government soil-health card costs very little and measures your actual field. Use this to decide which plots are worth testing.

© 2026 - 1acre.in - All Rights Reserved

LinkedIn iconYoutube iconInstagram icon